
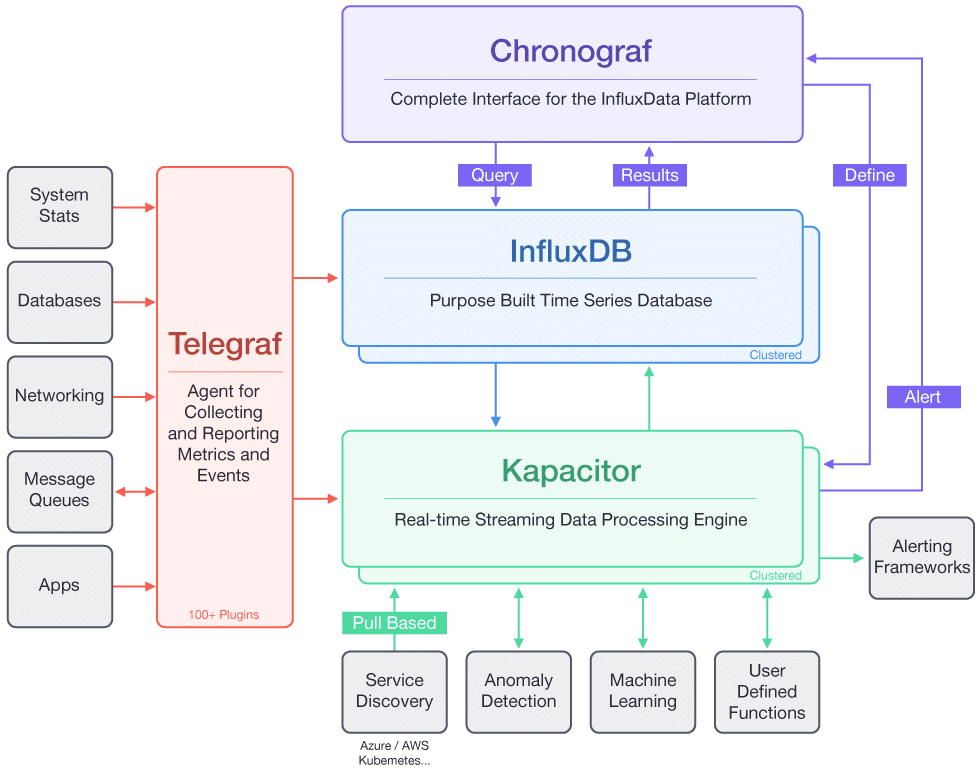
- Telegraf collects time-series data from a variety of sources.
- InfluxDB stores time-series data.
- Chronograf visualizes and graphs the time-series data.
- Kapacitor provides alerting and detects anomalies in time-series data
The TICK stack can be a powerful tool for storing, analyzing and visualizing time series data.
It has many features and use cases. And Kapacitor can detect errors or build live leaderboard of game scores.
My Conclusions
I think it is great tool with amazing dashboard for storing, analyzing and visualizing statistics/time series data.some very cool plugins for:
- AWS http://docs.grafana.org/features/datasources/cloudwatch/
- VMWare https://grafana.com/dashboards/2840 and many many others check it out at https://grafana.com/dashboards
But not sure if it can do what centreon/nagios can, I just find lack of flexibility as far as processing custom/simple text outputs.
there is a plugin called exec which I tried but it must have a specific influxdb line protocol, for writing points to the DB. heck, I just wanted it to process simple key words like OK/CRITICAL 🙁
Here is how I installed on Centos 7
GRAFANA (FrontEnd)
wget https://s3-us-west-2.amazonaws.com/grafana-releases/release/grafana-4.6.3-1.x86_64.rpm
sudo yum localinstall grafana-4.6.3-1.x86_64.rpm
INFLUXDB (backend)
prodcuts
Telegraf ( agent )
downloads
CREATE USER imon WITH PASSWORD ‘monitor’ WITH ALL PRIVILEGES
Grafana
http://
Influxdb
http://
Chronograf
http://
Good References:
Grafana How to
influxdb-and-grafana-on-centos
grafana-and-influxdb-quickstart-on-ubuntu
]]>